Durante il mio periodo di studio Erasmus al TU/e ho potuto provare per la prima volta l’esperienza di pubblicare un paper. Ho lavorato con i miei due compagni di gruppo Daan e Jules su un progetto di data visualization, che è iniziato come parte del corso di Algorithms for Geographic Data.
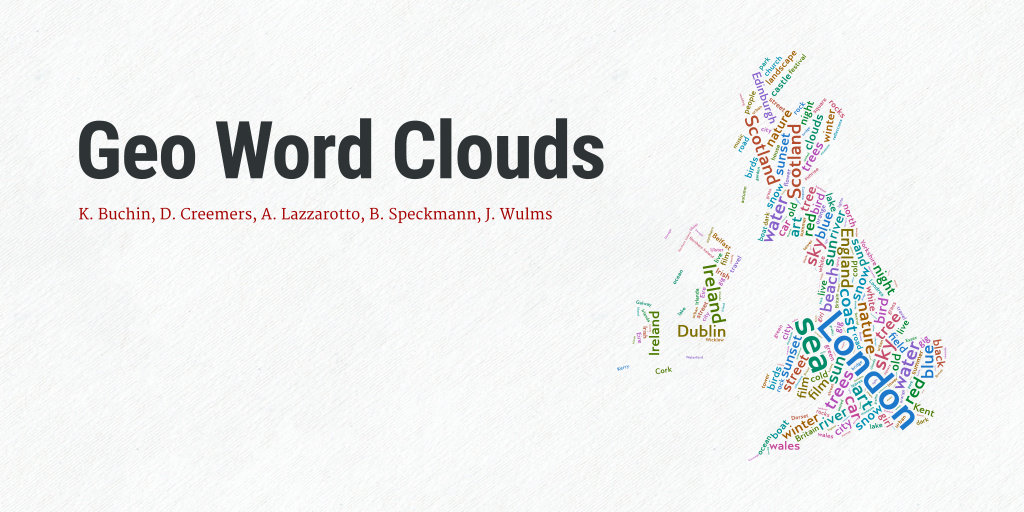
Il nostro lavoro, sotto la supervisione dei docenti Kevin Buchin e Bettina Speckmann, si è concentrato sul creare delle word cloud con informazioni geograficamente accurate. Le abbiamo chiamate geo word cloud. Il progetto è terminato con la preparazione di un paper, che è stato presentato al 2016 IEEE Pacific Visualization Symposium (PacificVis):
Geo word clouds
K. Buchin, D. Creemers, A. Lazzarotto, B. Speckmann, J. WulmsWord clouds are a popular method to visualize the frequency of words in textual data. Nowadays many text-based data sets, such as Flickr tags, are geo-referenced, that is, they have an important spatial component. However, existing automated methods to generate word clouds are unable to incorporate such spatial information. We introduce geo word clouds: word clouds which capture not only the frequency but also the spatial relevance of words. […]
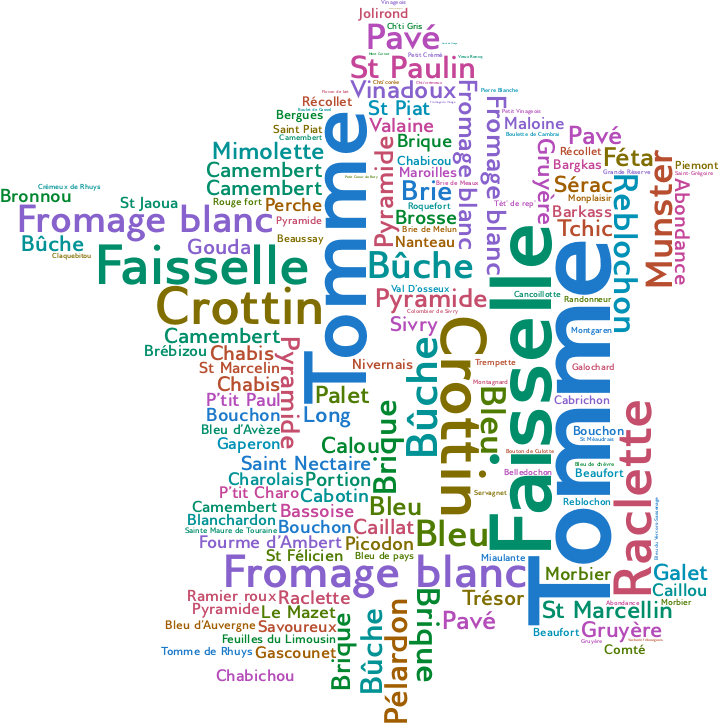
Qui potete vedere una mappa generata col nostro algoritmo, scritto usando Python e SageMath:
La IEEE Copyright Policy permette esplicitamente agli autori di condividere i propri paper sui siti personali. Per questo motivo, condivido l’accepted version del paper assieme a questo avviso:
© 2016 IEEE. Personal use of this material is permitted. Permission from IEEE must be obtained for all other uses, in any current or future media, including reprinting/republishing this material for advertising or promotional purposes, creating new collective works, for resale or redistribution to servers or lists, or reuse of any copyrighted component of this work in other works.
